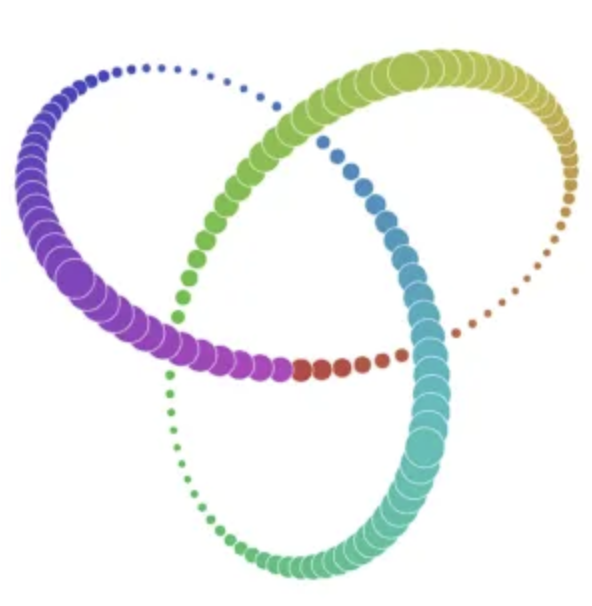
t-distributed Stochastic Neighbour Embedding
t-SNE is a non-linear dimensionality reduction, ie, it allows us to separate data which cannot be separated by any straight line.
t-SNE vs PCA
- t-SNE is iterative, so unlike PCA it cannot be applied to another dataset.
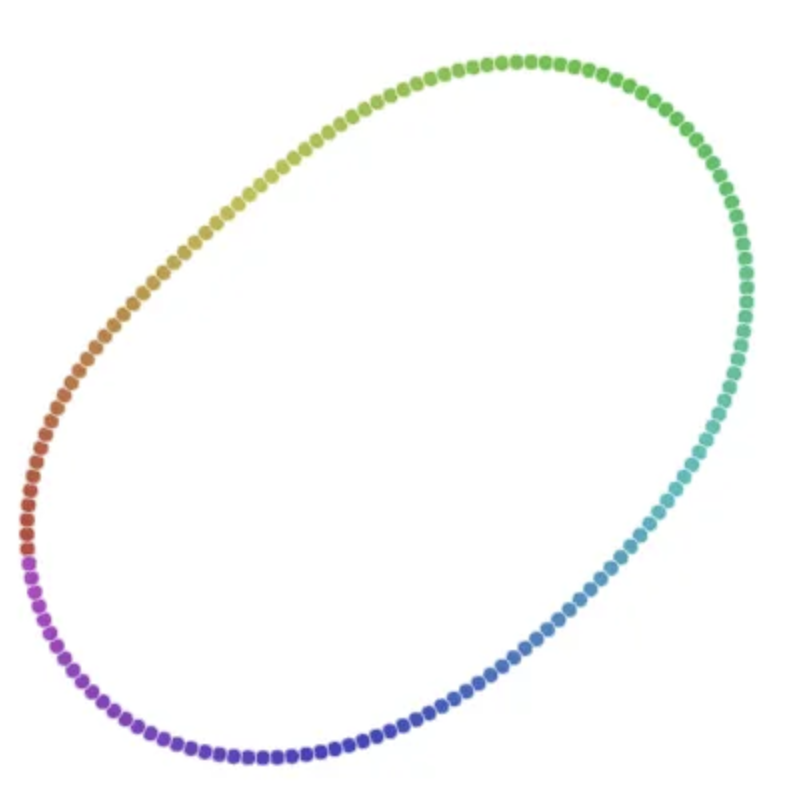
- t-SNE is used to understand high-dimensional data, and project it into low-dimensional space (like 2D or 3D).
Detailed Explanation
- Problem: To understand high-dimensional datasets, less useful to perform dimensionality reduction for ML training.
- Details:
- t-SNE cannot be reapplied similar to PCA, since t-SNE is iterative and non deterministic.
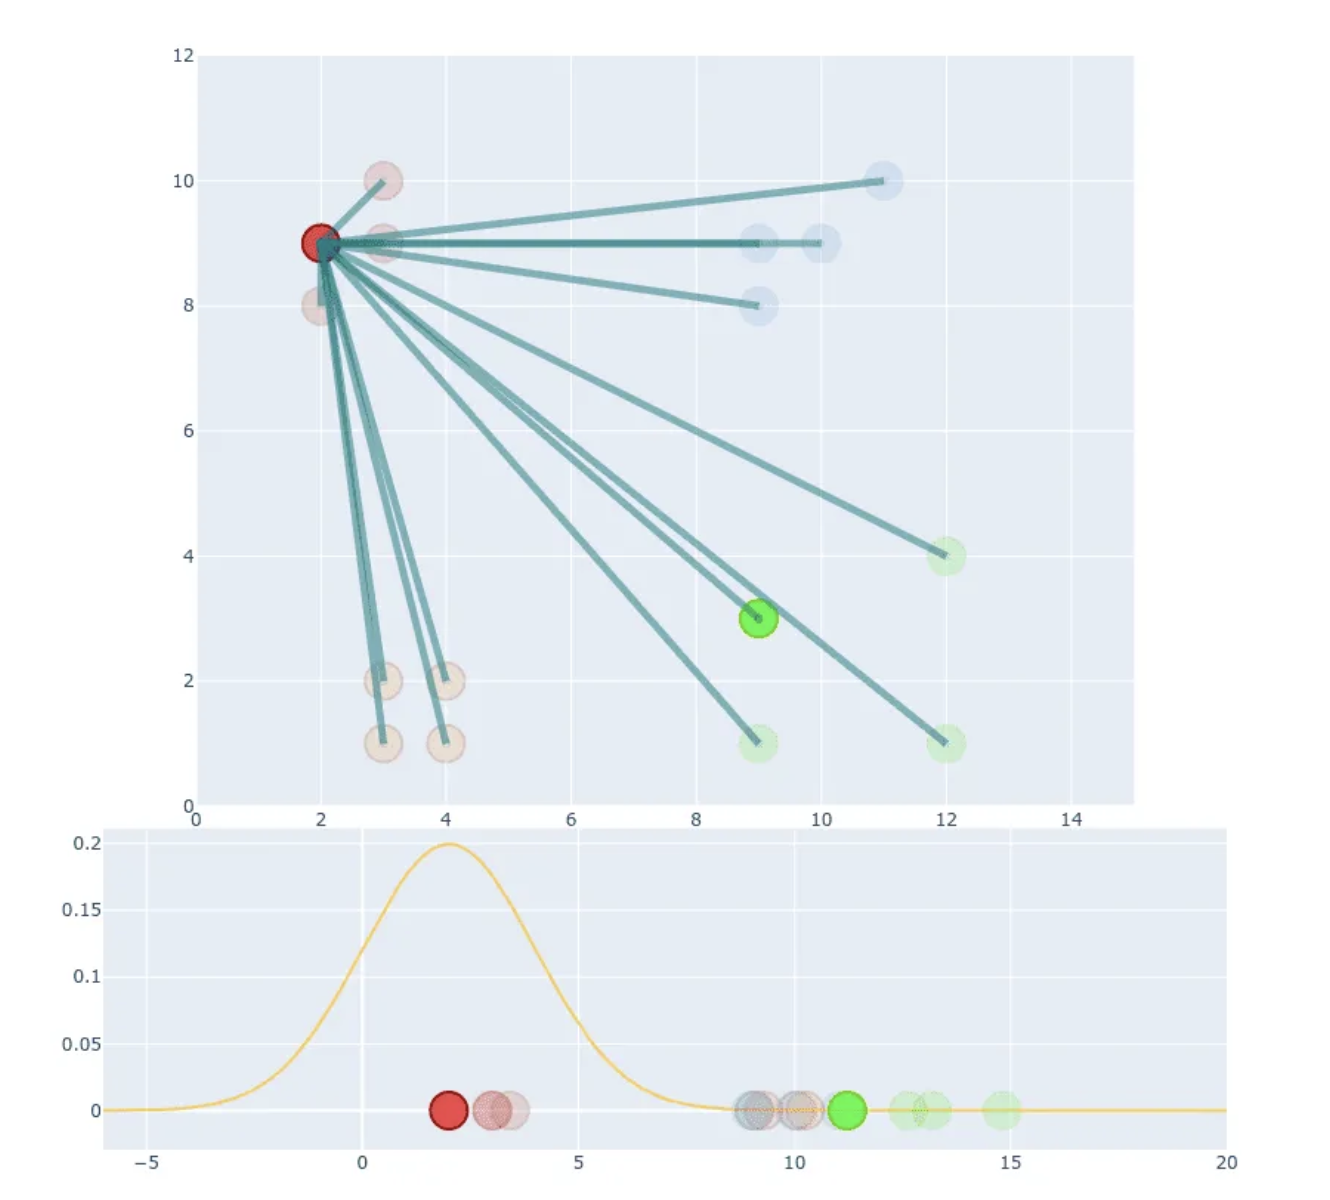
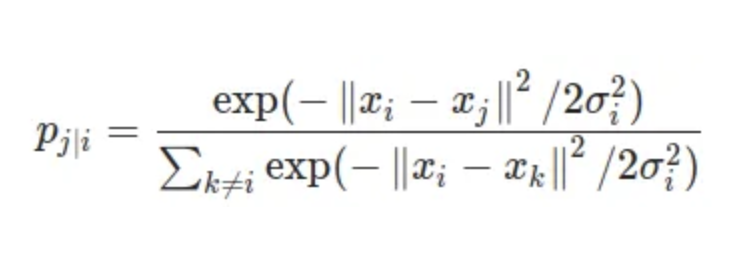
- STEP 1: Creating similarities, ie, probability distribution.
- Create probability distribution that represents similarities between neighbours.
- Here similarity of datapoint to datapoint is the conditional probability , that would pick as its neighbour.
- This similarity is proportional to probability density under Gaussian centered at .
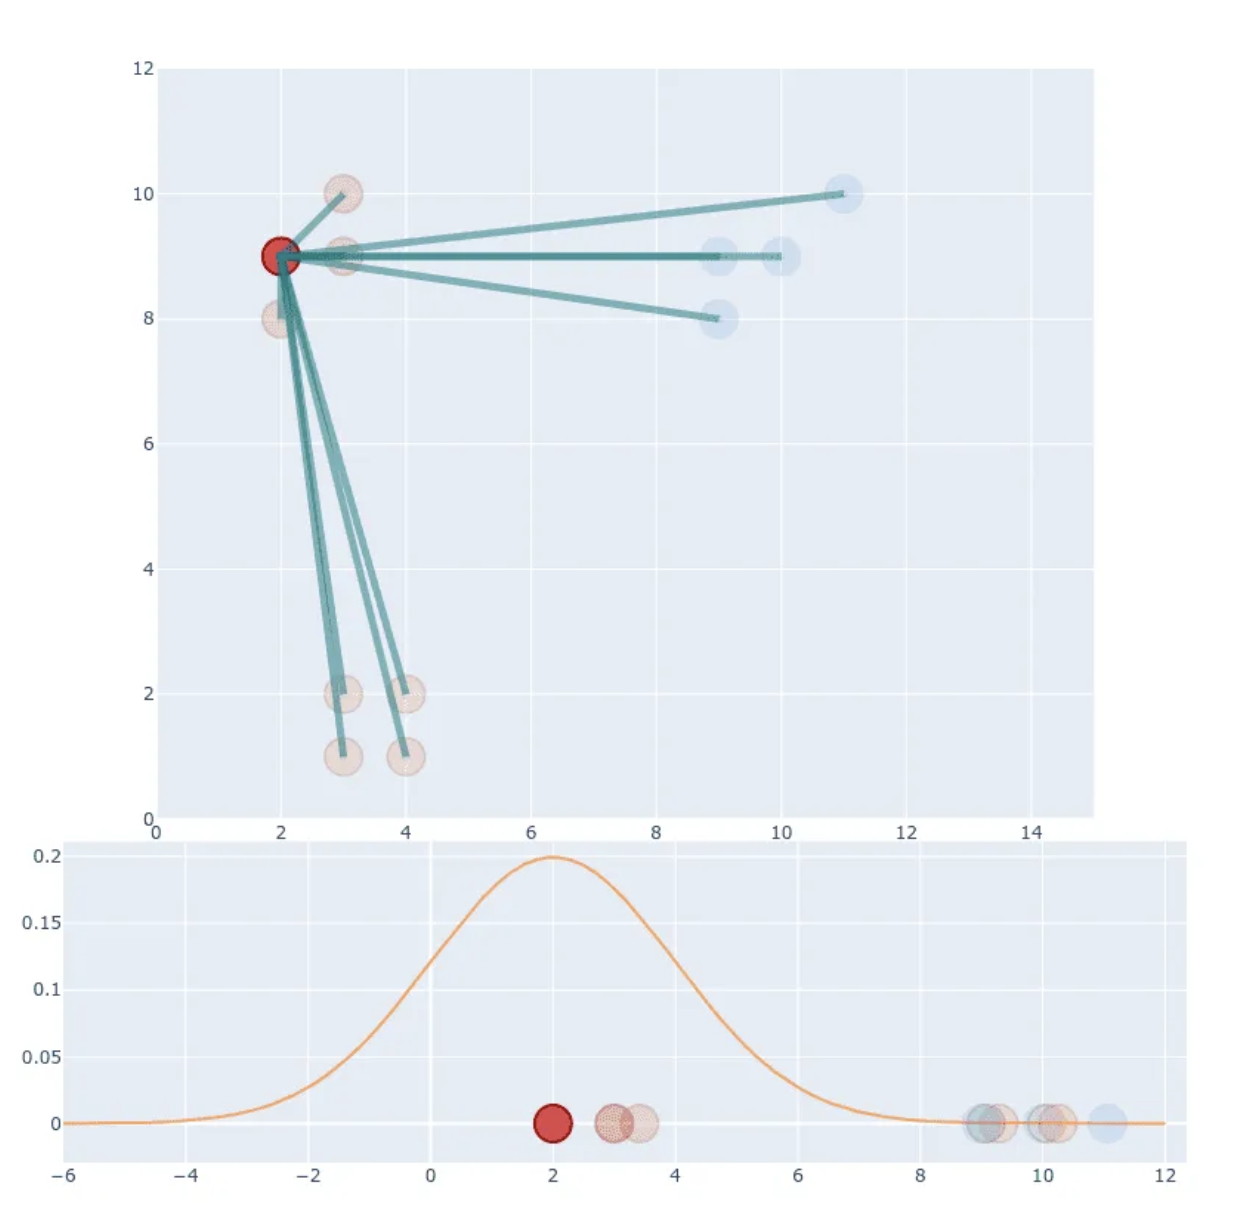
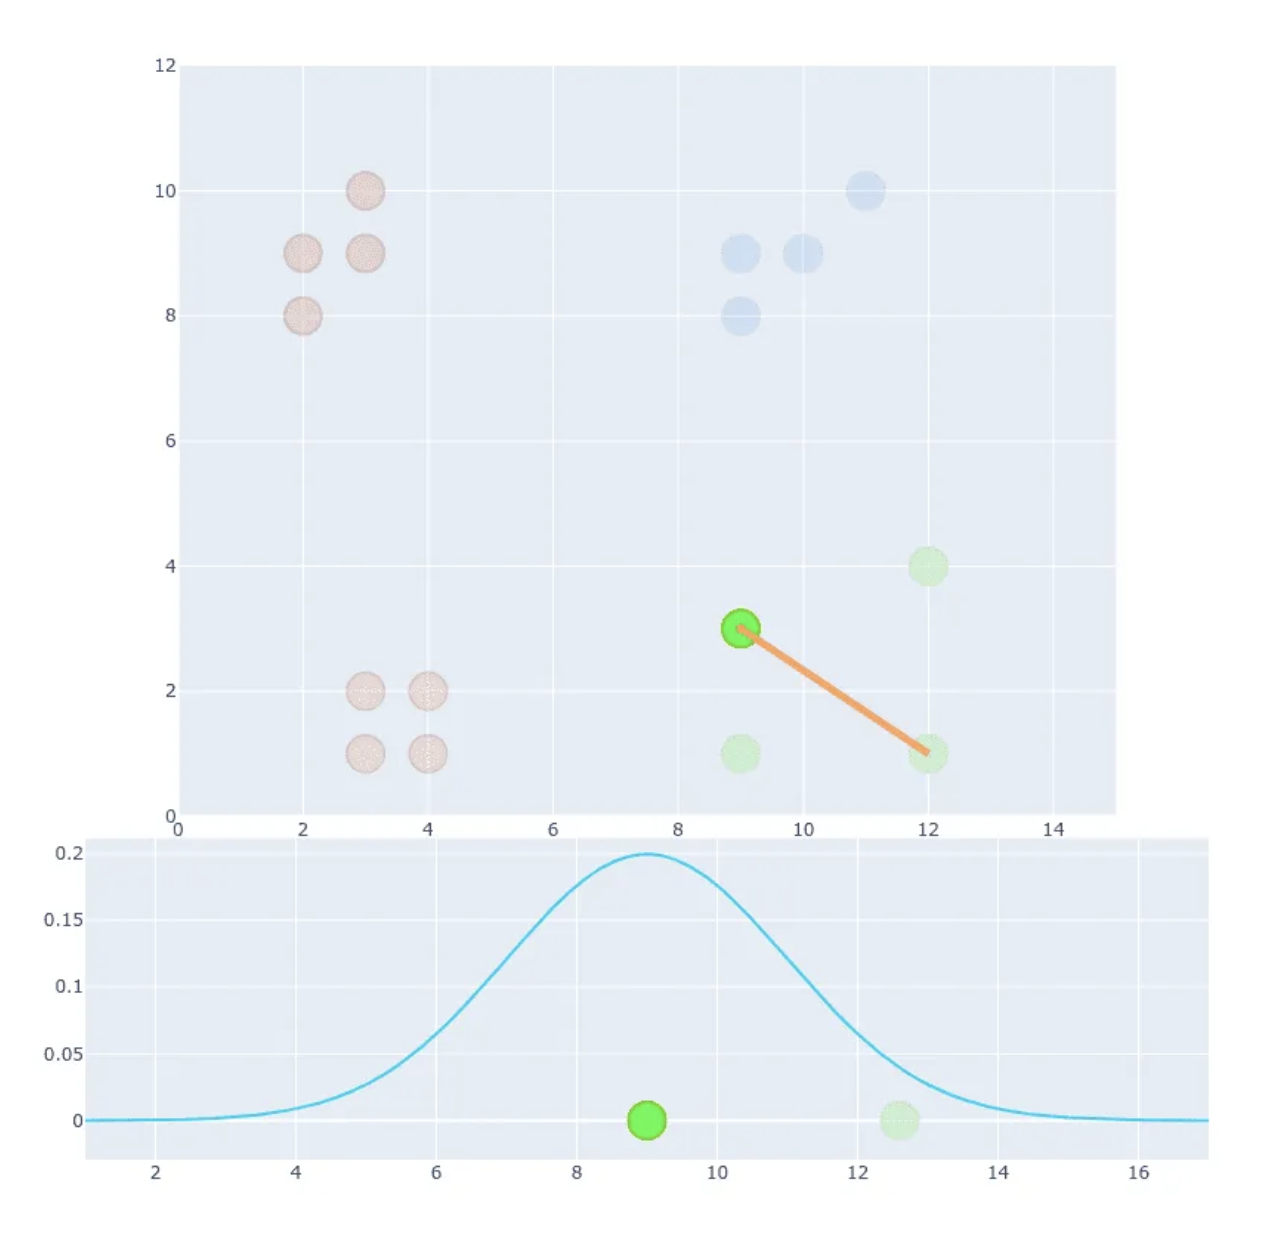
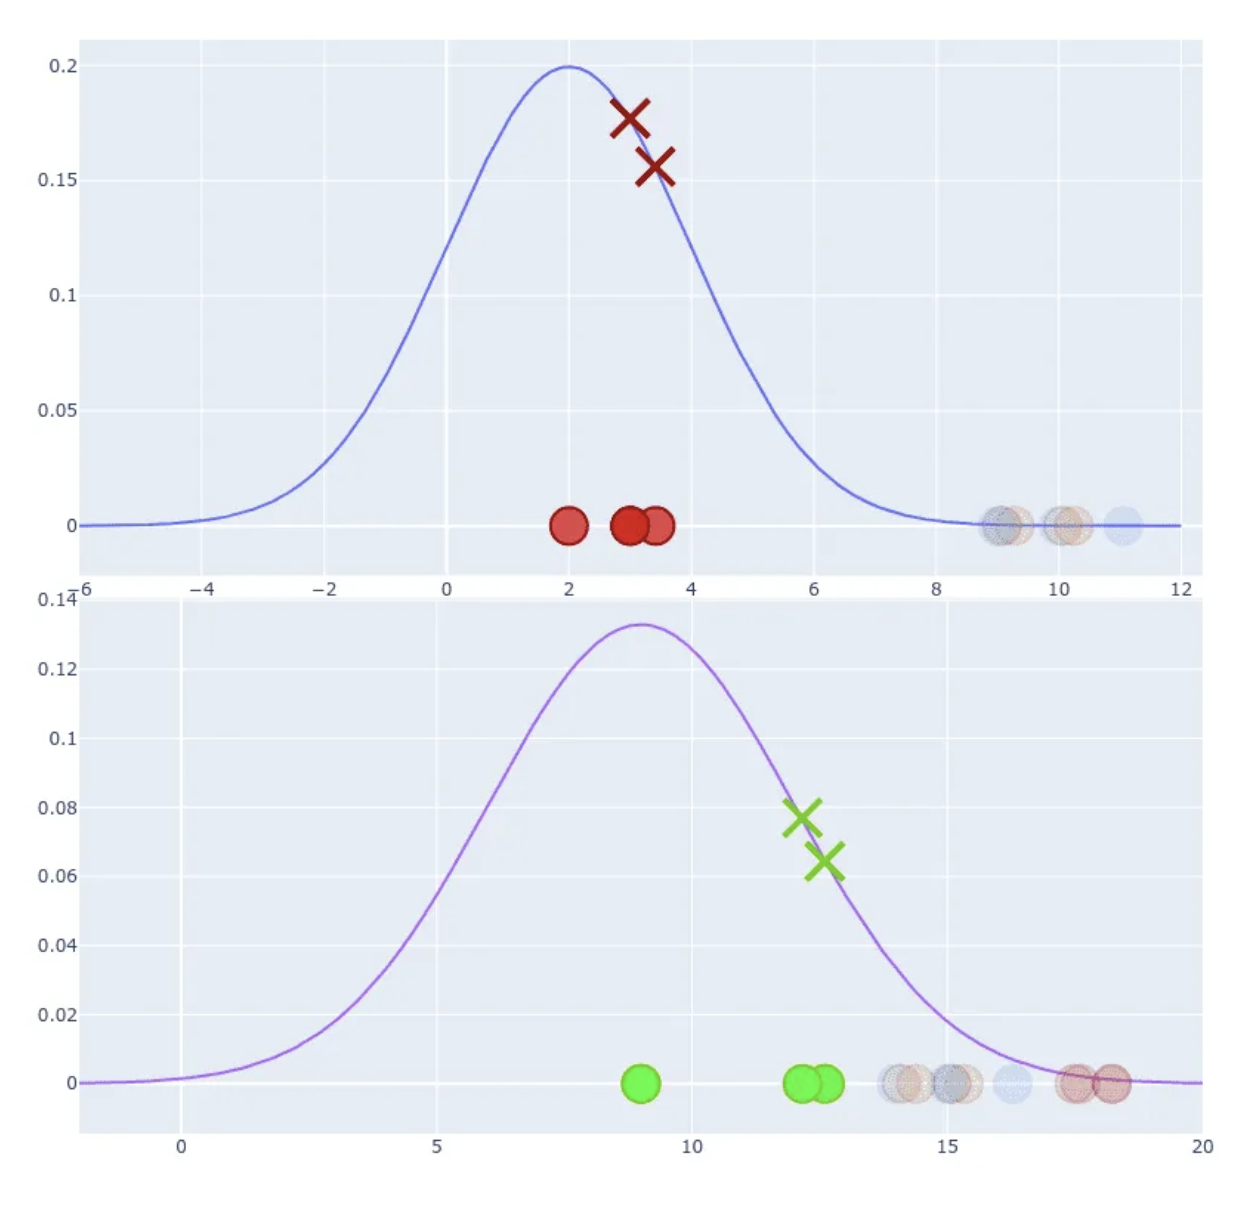
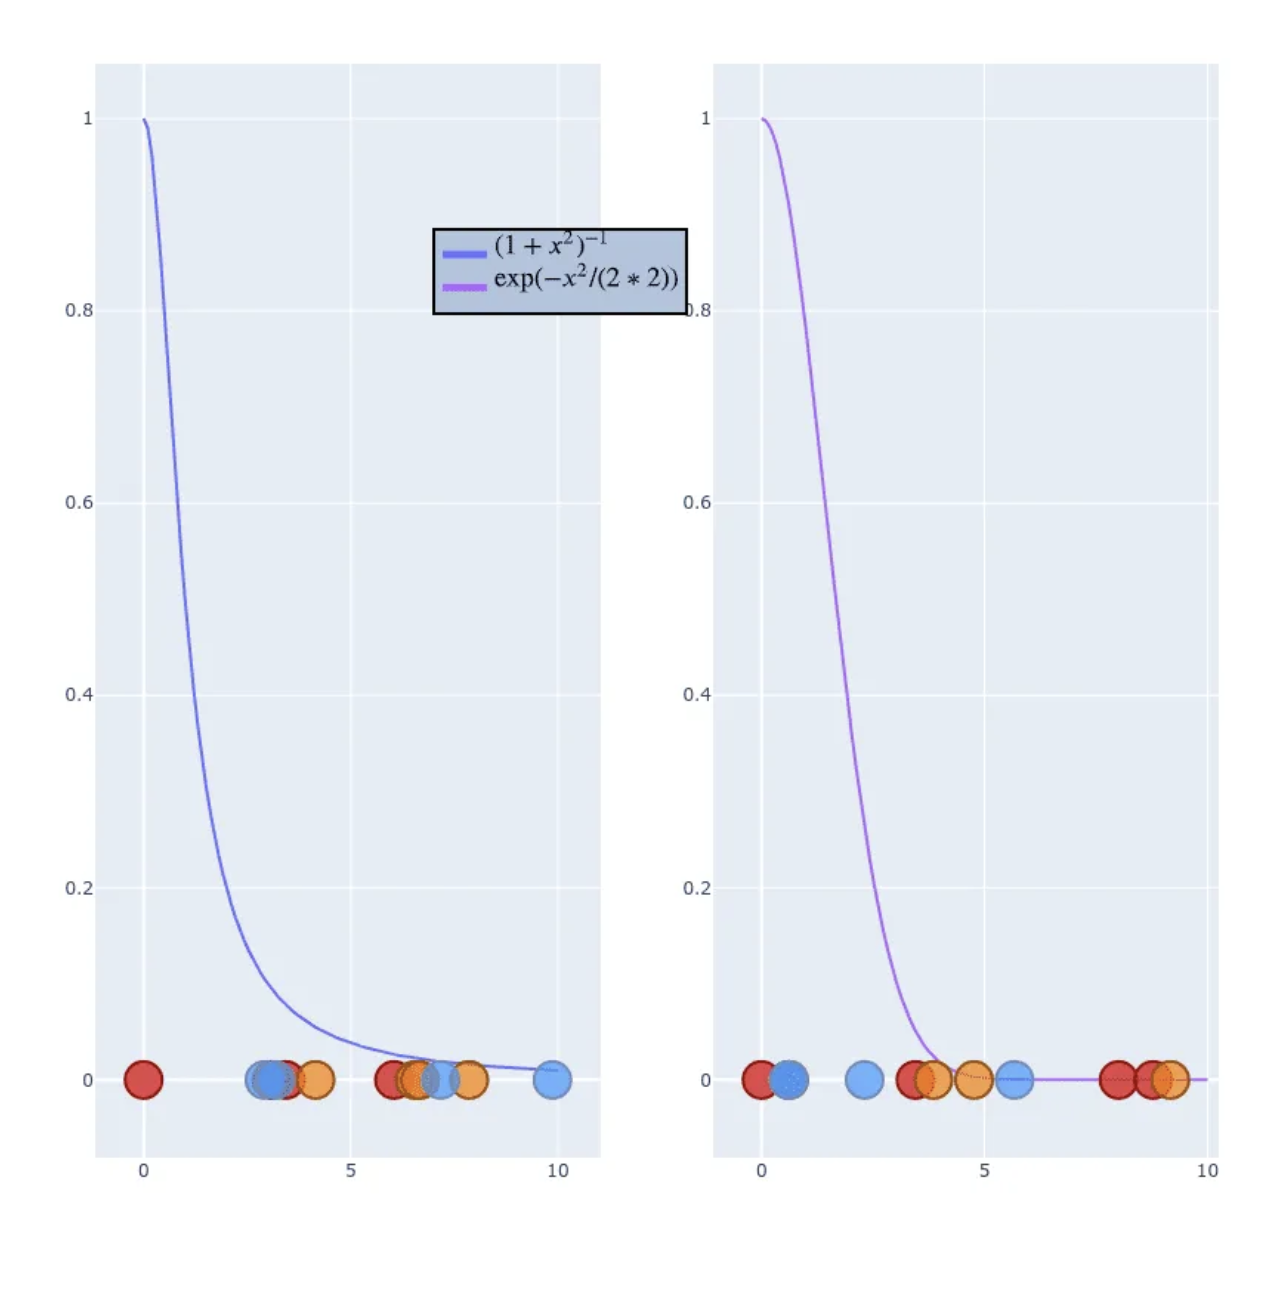
- We can distinguish b/w similar and non-similar points, but absolute values of probability are much smaller than in first example (compare Y-axis values).
- We can fix that by normalisation
- This scales all values to have a sum equal to 1. We set , not 1.
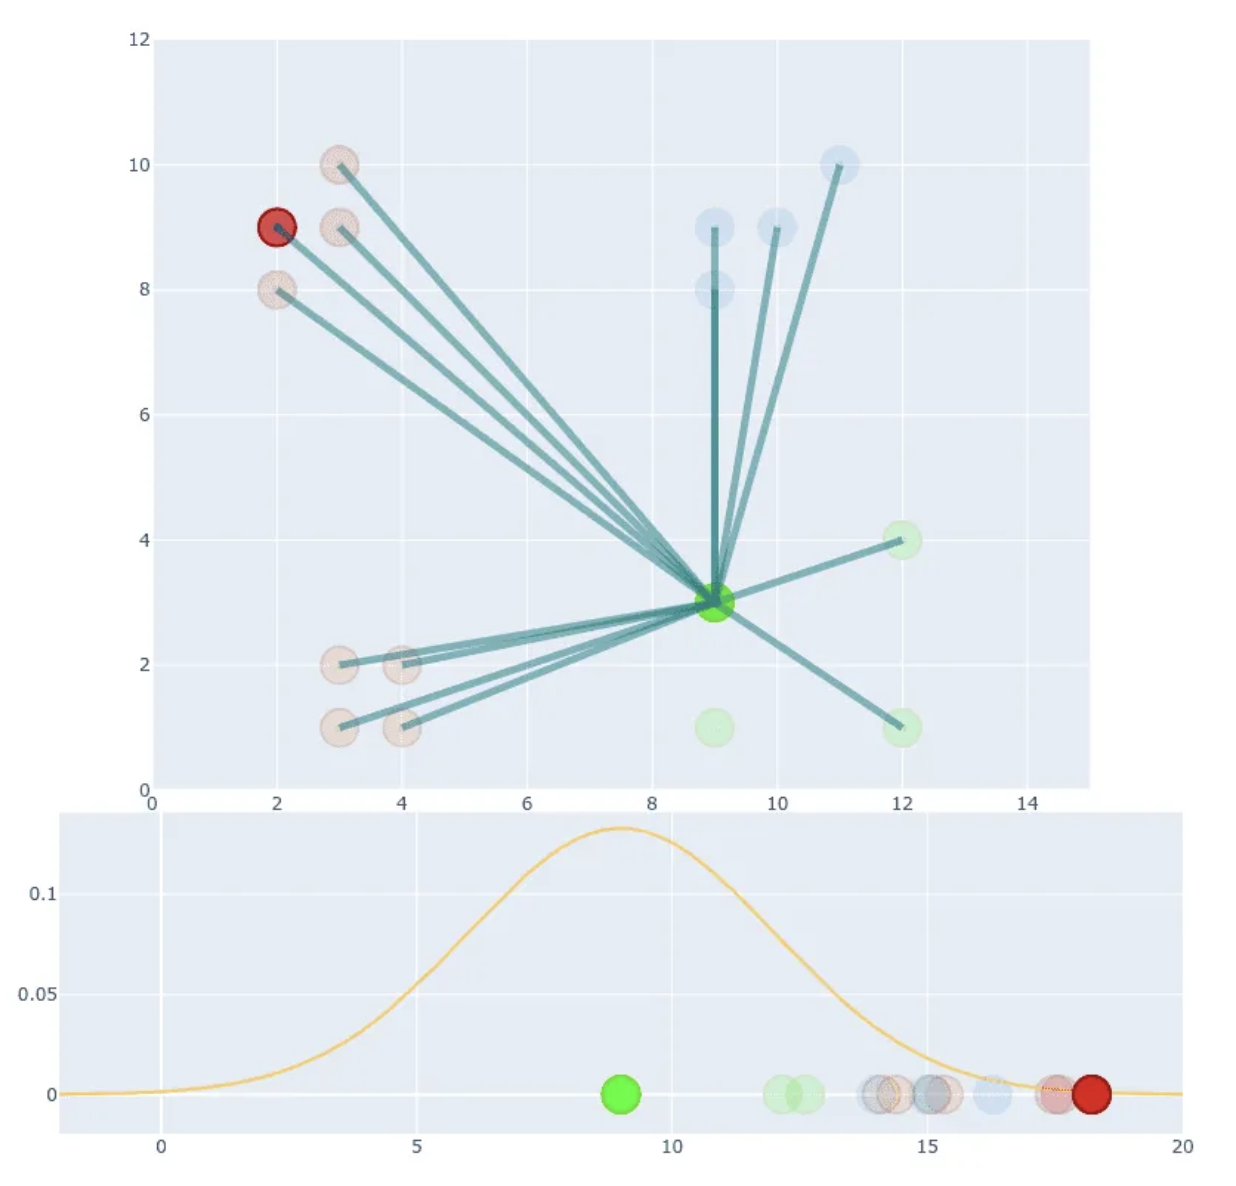
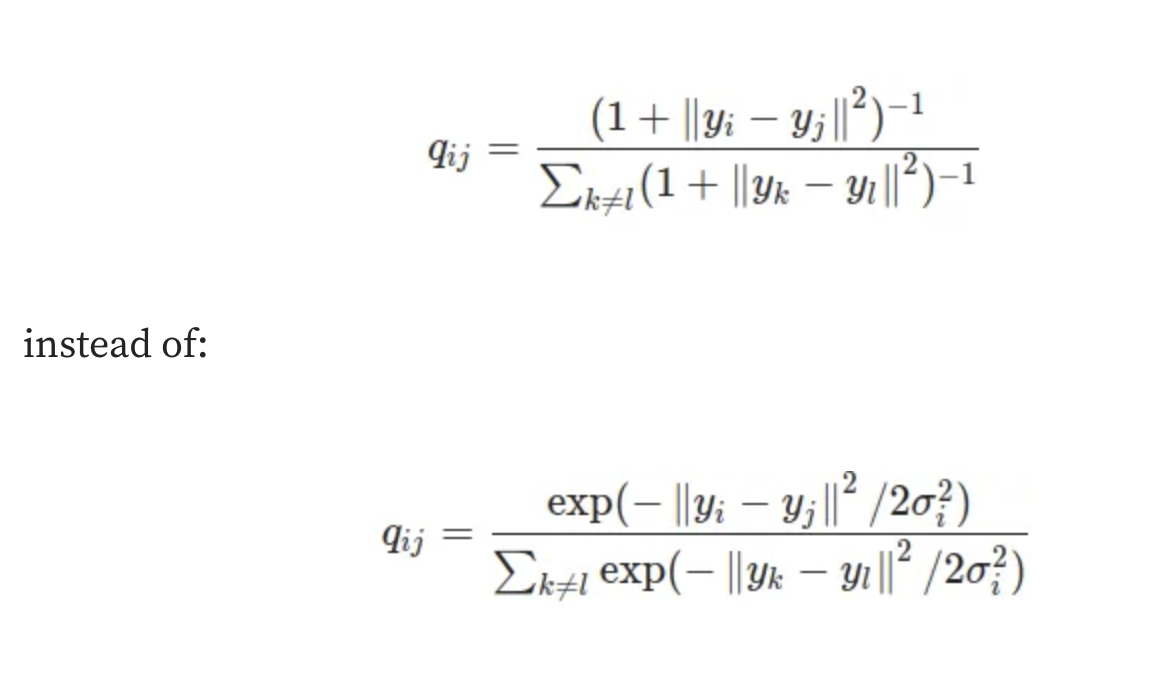
- STEP 2: Dealing with different distances
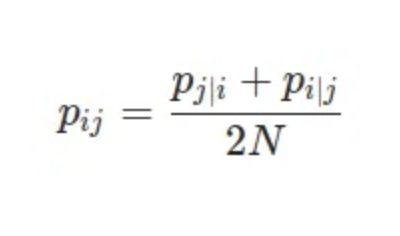
- Where N is number of dimensions.
- STEP 3: Final formula
- We haven’t used any variance, for gaussian distribution.
- This is the final formula
- STEP 4: Create low-dimensional space
- Gaussian distribution has “short tail”, so it creates crowding problem.
- To solve it we use Student t-distribution with a single degree of freedom.
- Visual comparison between Gaussian and Student t-distribution
The Gradient Descent
To optimise this distribution t-SNE is using Kullback-Leibler divergence between the conditional probabilities and .
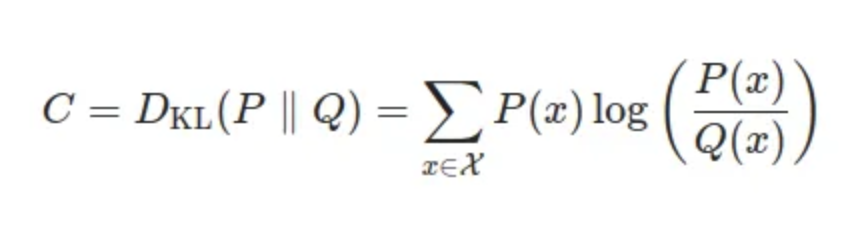
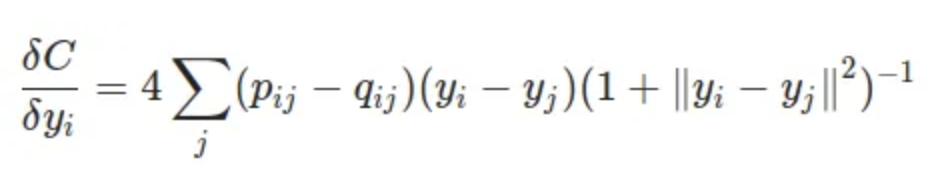
The gradient descent step can be treated as repulsion and attraction between points.
What are we updating in t-SNE gradient descent optimisation step???
We are updating the y_i position, the datapoint around which we are estimating the distribution.
t-SNE and CNN feature maps
t-SNE can be used when dealing with CNN feature maps, it helps us understand which input data seems similar from the n-layer features extracted for an image.